Поиск:
Войти
Книги автора: Peter G. Aitken
Сортировка
- сначала новые
- сначала новые
- по рейтингу
- по просмотрам
- по названию
Добавлено
Год выхода: 2018
Язык: Английский
Make Excel do the math and make sense of your data Use the Insert Function dialog box, array formula…
Make Excel do the math and make sense of your data Use the Insert Function dialog box, array formulas and functions, and more Excel 2007 has more than 500 built-in functions. This book looks at the top 150, so you can find out which ones will make your life easier. Want to compare a 15-year mortgage to a 30-year mortgage? Forecast expenses for your college freshman? See how your online business is doing? Here's the fun and easy way! Discover how to * Create worksheets to track costs and revenue * Tell the difference among average, median, and mode * Work with statistical functions * Develop forecasts and track trends * Manipulate strings and work with database functions
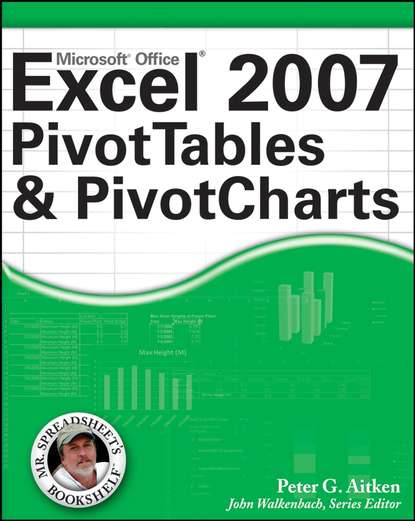
Devoted entirely to PivotTables and PivotCharts, this book shows you how to take full advantage of t…
Devoted entirely to PivotTables and PivotCharts, this book shows you how to take full advantage of these powerful tools, which enable you to pull meaningful information from masses of seemingly meaningless data. Loaded with illustrations and real-world examples, it takes you step by step through creating a PivotTable; formatting, filtering, and grouping data; creating PivotCharts from those data; and more. You’ll learn to work with multidimensional data, how to create and manipulate PivotTables using VBA, and—most importantly—you’ll discover what these tools can do for you.
1
Популярные книги


